Advanced: Simulating batch effects
Source:vignettes/advanced_topics/simulating_batch_effects.Rmd
simulating_batch_effects.RmdAn easy way of simulating batch effects is by performing multiple
dyngen runs, but with different kinetics. dyngen samples the GRN
kinetics randomly from a set of predefined distributions (See
?generate_kinetics).
Create underlying gene regulatory network
First, create the ‘common’ part of the dyngen simulation as follows. This will ensure that the gene regulatory network-part of the simulation is exactly the same.
library(tidyverse)
library(dyngen)

set.seed(1)

backbone <- backbone_bifurcating()
config <-
  initialise_model(
    backbone = backbone,
    num_cells = 1000,
    num_tfs = nrow(backbone$module_info),
    num_targets = 250,
    num_hks = 250,
    simulation_params = simulation_default(
      census_interval = 10,
      ssa_algorithm = ssa_etl(tau = 300 / 3600),
      experiment_params = simulation_type_wild_type(num_simulations = 100)
    )
  )
# the simulation is being sped up because rendering all vignettes with one core
# for pkgdown can otherwise take a very long time
set.seed(1)

config <-
  initialise_model(
    backbone = backbone,
    num_cells = 1000,
    num_tfs = nrow(backbone$module_info),
    num_targets = 50,
    num_hks = 50,
    verbose = interactive(),
    download_cache_dir = tools::R_user_dir("dyngen", "data"),
    simulation_params = simulation_default(
      census_interval = 5,
      ssa_algorithm = ssa_etl(tau = .01),
      experiment_params = simulation_type_wild_type(num_simulations = 10)
    )
  )
model_common <-
  config %>%
  generate_tf_network() %>%
  generate_feature_network()
Simulate multiple times with different kinetics
Now you can run the simulation multiple times. Note that for each
separate run, the generate_kinetics() step ensures that the
thermodynamic parameters will be different (yet drawn from the same
distribution). Some values for the kinetics of the main transcription
factors are not changed, to ensure that the desired dynamic process is
obtained.
model_a <- model_common %>%
  generate_kinetics() %>%
  generate_gold_standard() %>%
  generate_cells()
model_b <- model_common %>%
  generate_kinetics() %>%
  generate_gold_standard() %>%
  generate_cells()
The differences if kinetics parameters can be visualised as follows.
params_a <-
  dyngen:::.kinetics_extract_parameters_as_df(model_a$feature_info, model_a$feature_network) %>%
  select(id, group = param, model_a = value)

params_b <-
  dyngen:::.kinetics_extract_parameters_as_df(model_b$feature_info, model_b$feature_network) %>%
  select(id, group = param, model_b = value)

params_ab <-
  inner_join(params_a, params_b, by = c("id", "group"))

ggplot(params_ab) +
  geom_point(aes(model_a, model_b, colour = group)) +
  facet_wrap(~group, scales = "free") +
  theme_bw()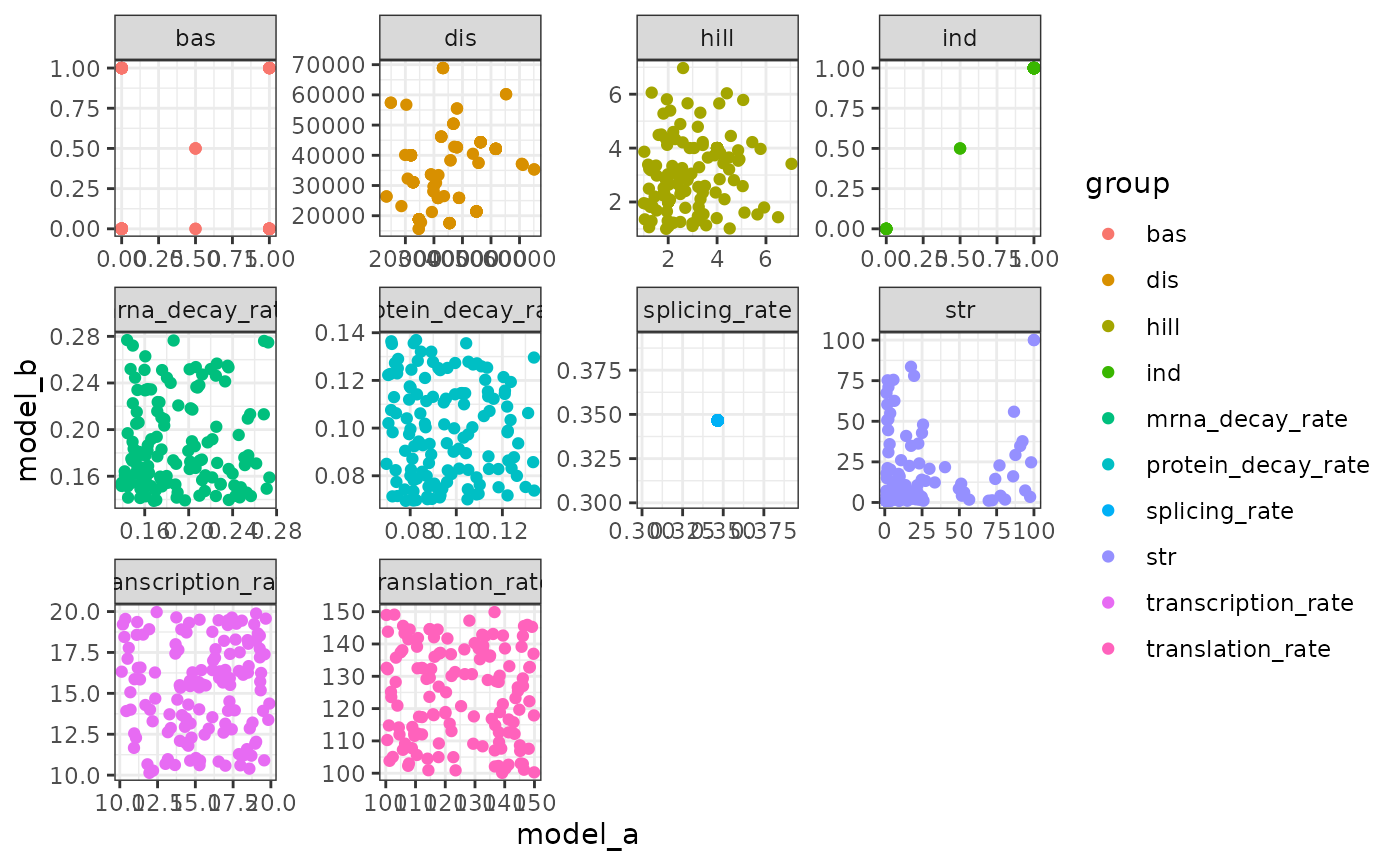
Combine outputs and visualise
Finally, combine the simulations as follows.
model_ab <-
  combine_models(list(left = model_a, right = model_b)) %>%
  generate_experiment()
## Warning in params$fun(network = network, sim_meta = sim_meta, params = model$experiment_params, : One of the branches did not obtain enough simulation steps.
## Increase the number of simulations (see `?simulation_default`) or decreasing the census interval (see `?simulation_default`).Show a dimensionality reduction.
plot_simulations(model_ab)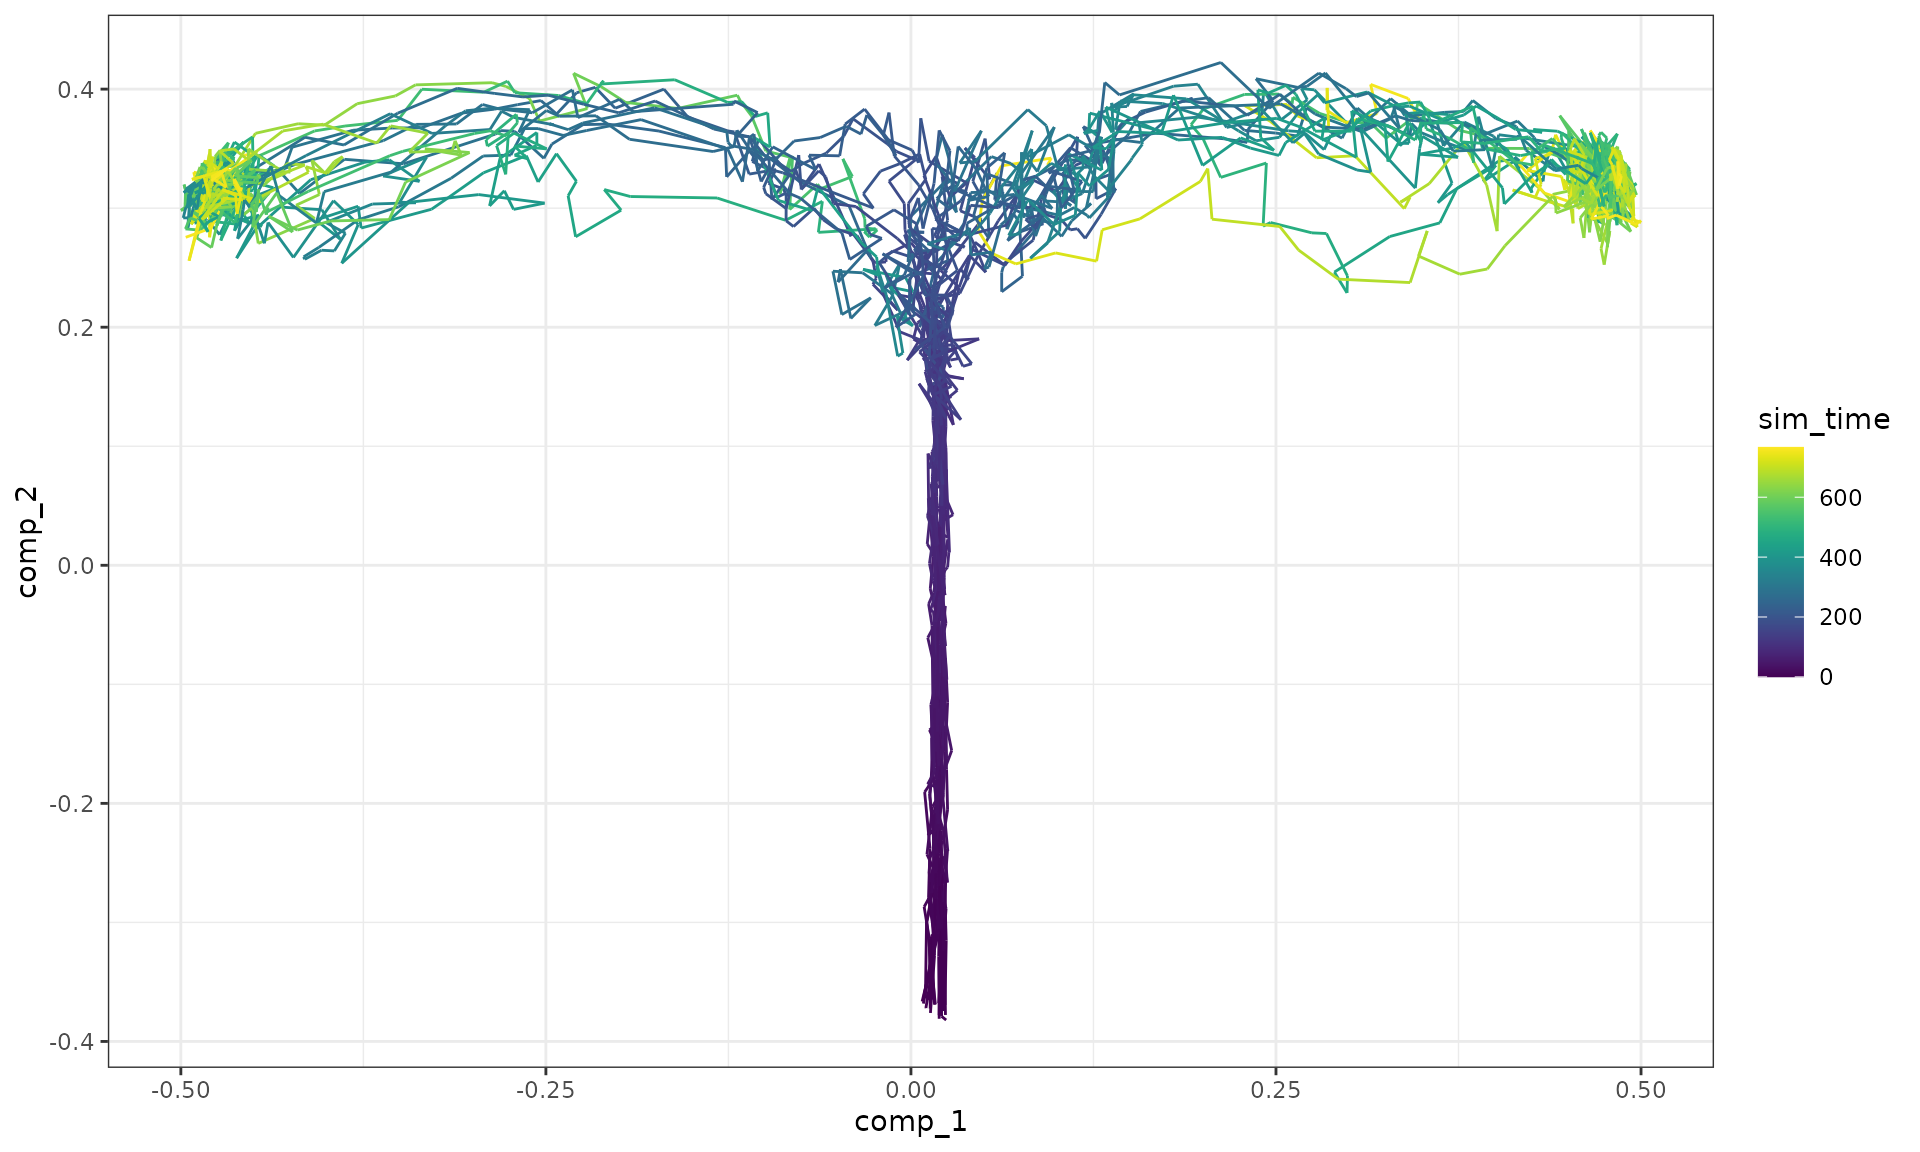
plot_gold_mappings(model_ab, do_facet = FALSE)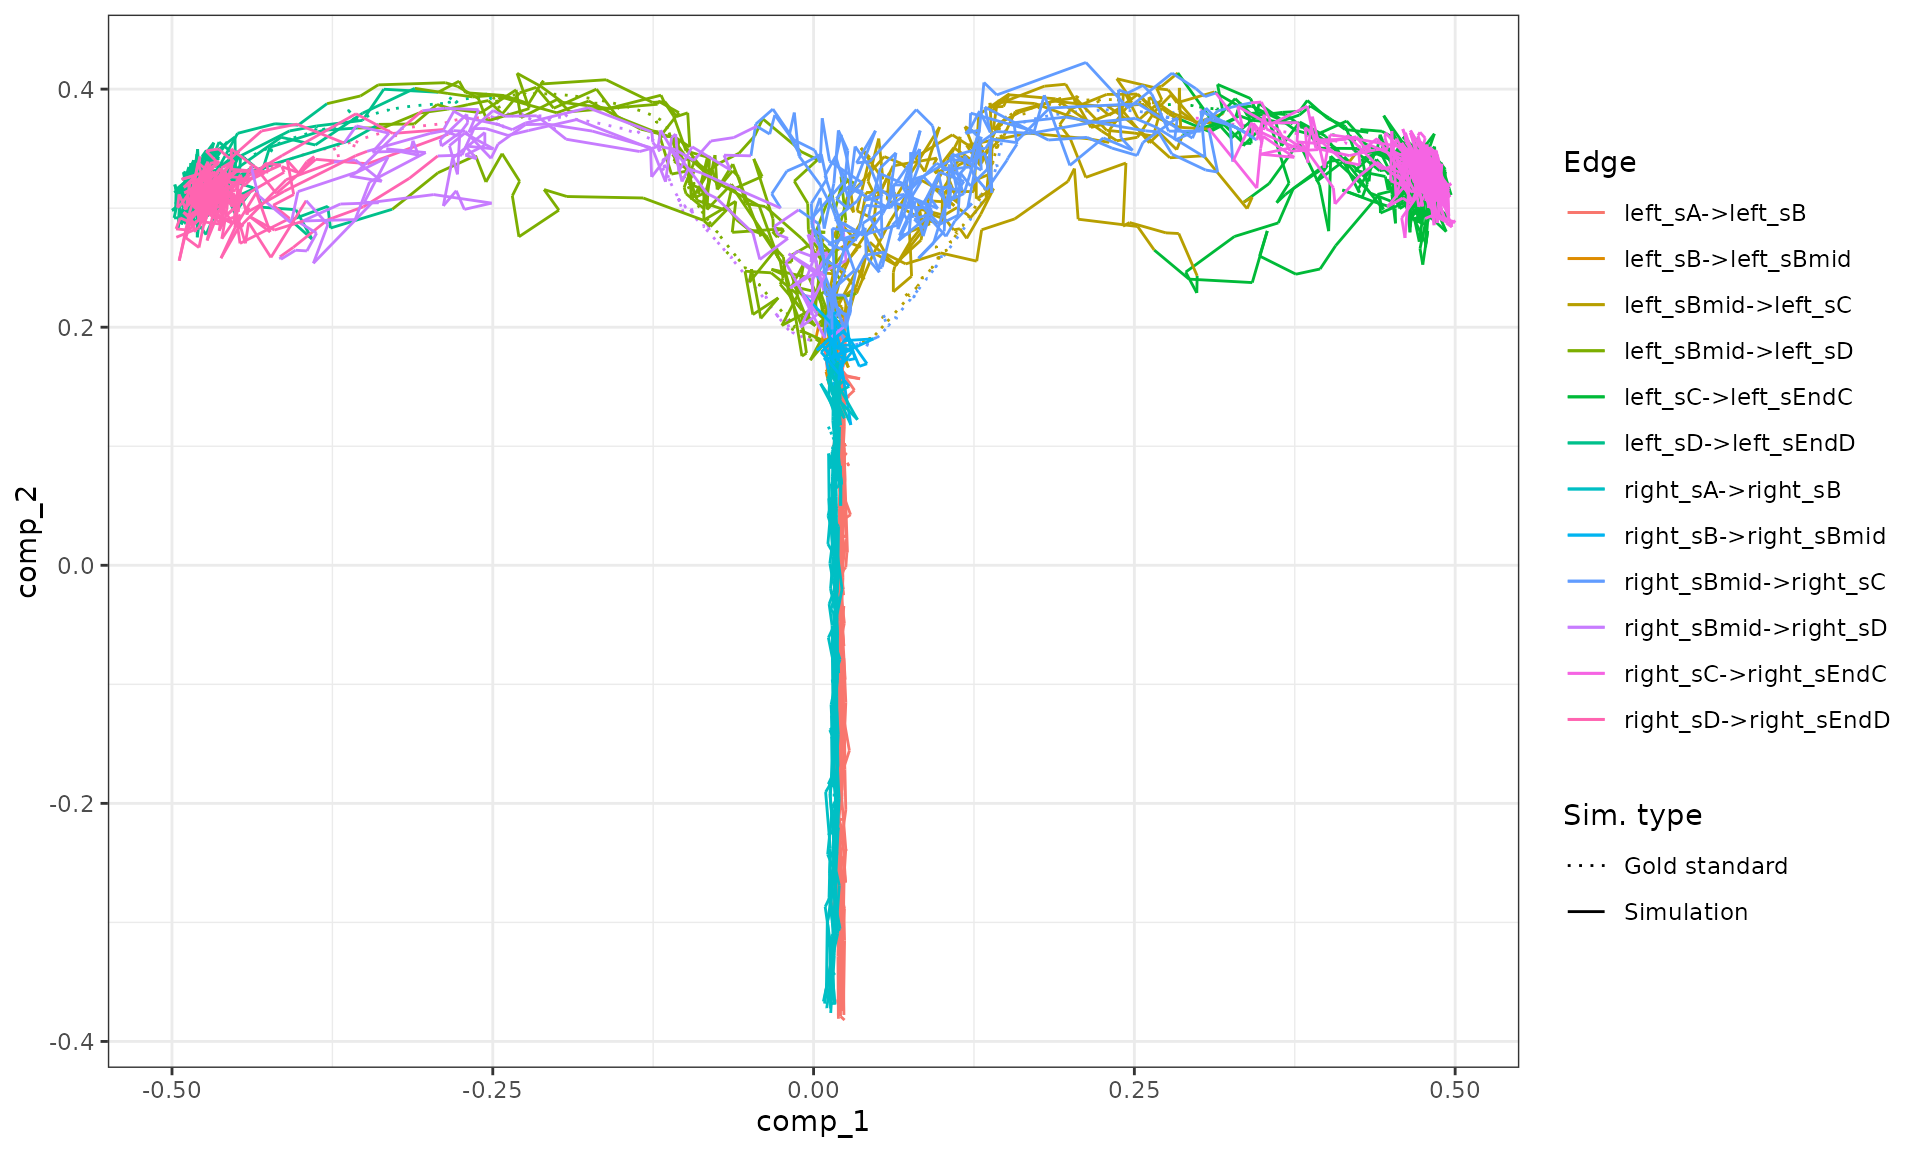
Visualise the dataset using dyno.
## Loading required package: dynfeature## Loading required package: dynguidelines## Loading required package: dynmethods## Loading required package: dynplot## Loading required package: dynwrap
dataset <- as_dyno(model_ab)
plot_dimred(dataset)
## Coloring by milestone## Using milestone_percentages from trajectory## Warning: Using `size` aesthetic for lines was deprecated in ggplot2 3.4.0.
## ℹ Please use `linewidth` instead.
## ℹ The deprecated feature was likely used in the dynplot package.
## Please report the issue at <https://github.com/dynverse/dynplot/issues>.
## This warning is displayed once per session.
## Call `lifecycle::last_lifecycle_warnings()` to see where this warning was
## generated.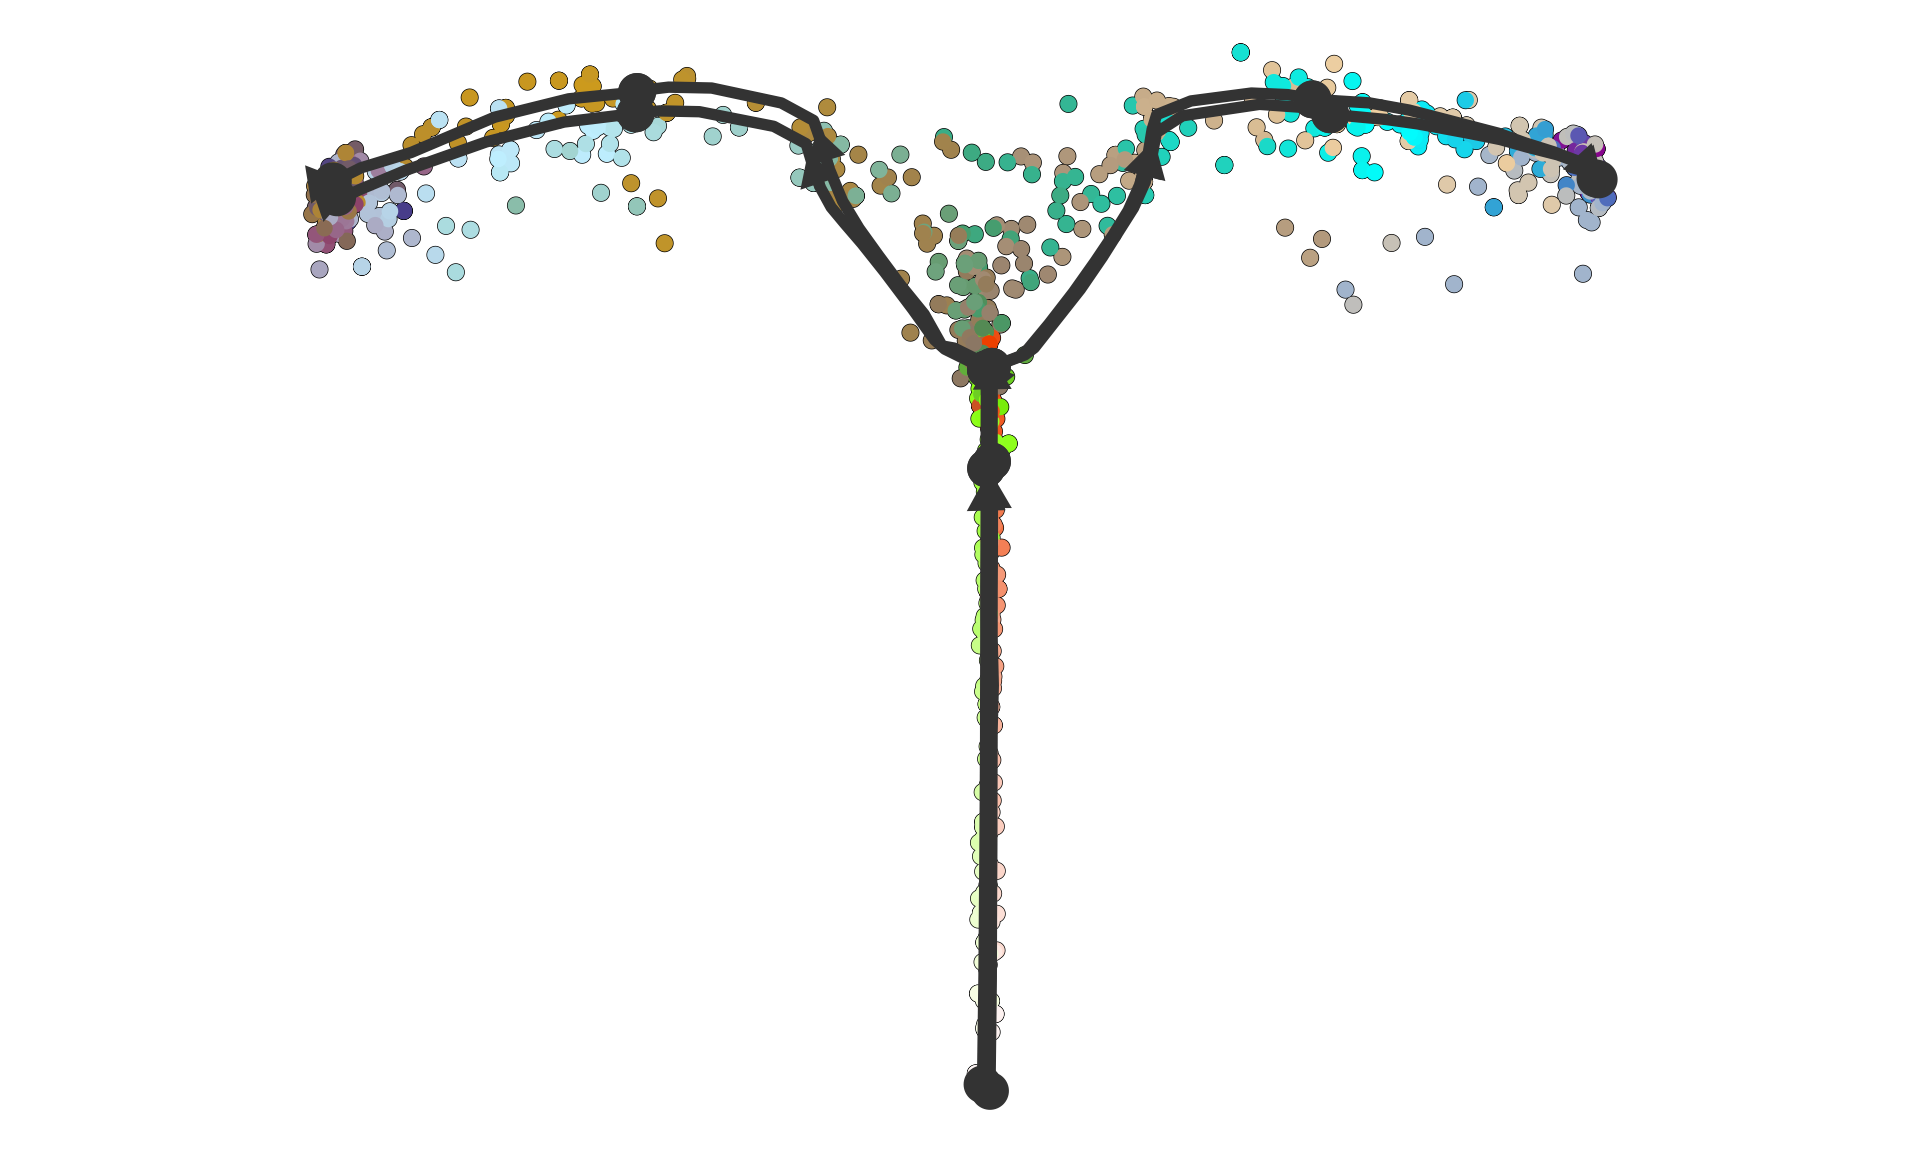
plot_heatmap(dataset, features_oi = 50)## No features of interest provided, selecting the top 50 features automatically## Using dynfeature for selecting the top 50 features## root cell or milestone not provided, trying first outgoing milestone_id## Using 'left_sA' as root## Coloring by milestone## Warning: `aes_string()` was deprecated in ggplot2 3.0.0.
## ℹ Please use tidy evaluation idioms with `aes()`.
## ℹ See also `vignette("ggplot2-in-packages")` for more information.
## ℹ The deprecated feature was likely used in the dynplot package.
## Please report the issue at <https://github.com/dynverse/dynplot/issues>.
## This warning is displayed once per session.
## Call `lifecycle::last_lifecycle_warnings()` to see where this warning was
## generated.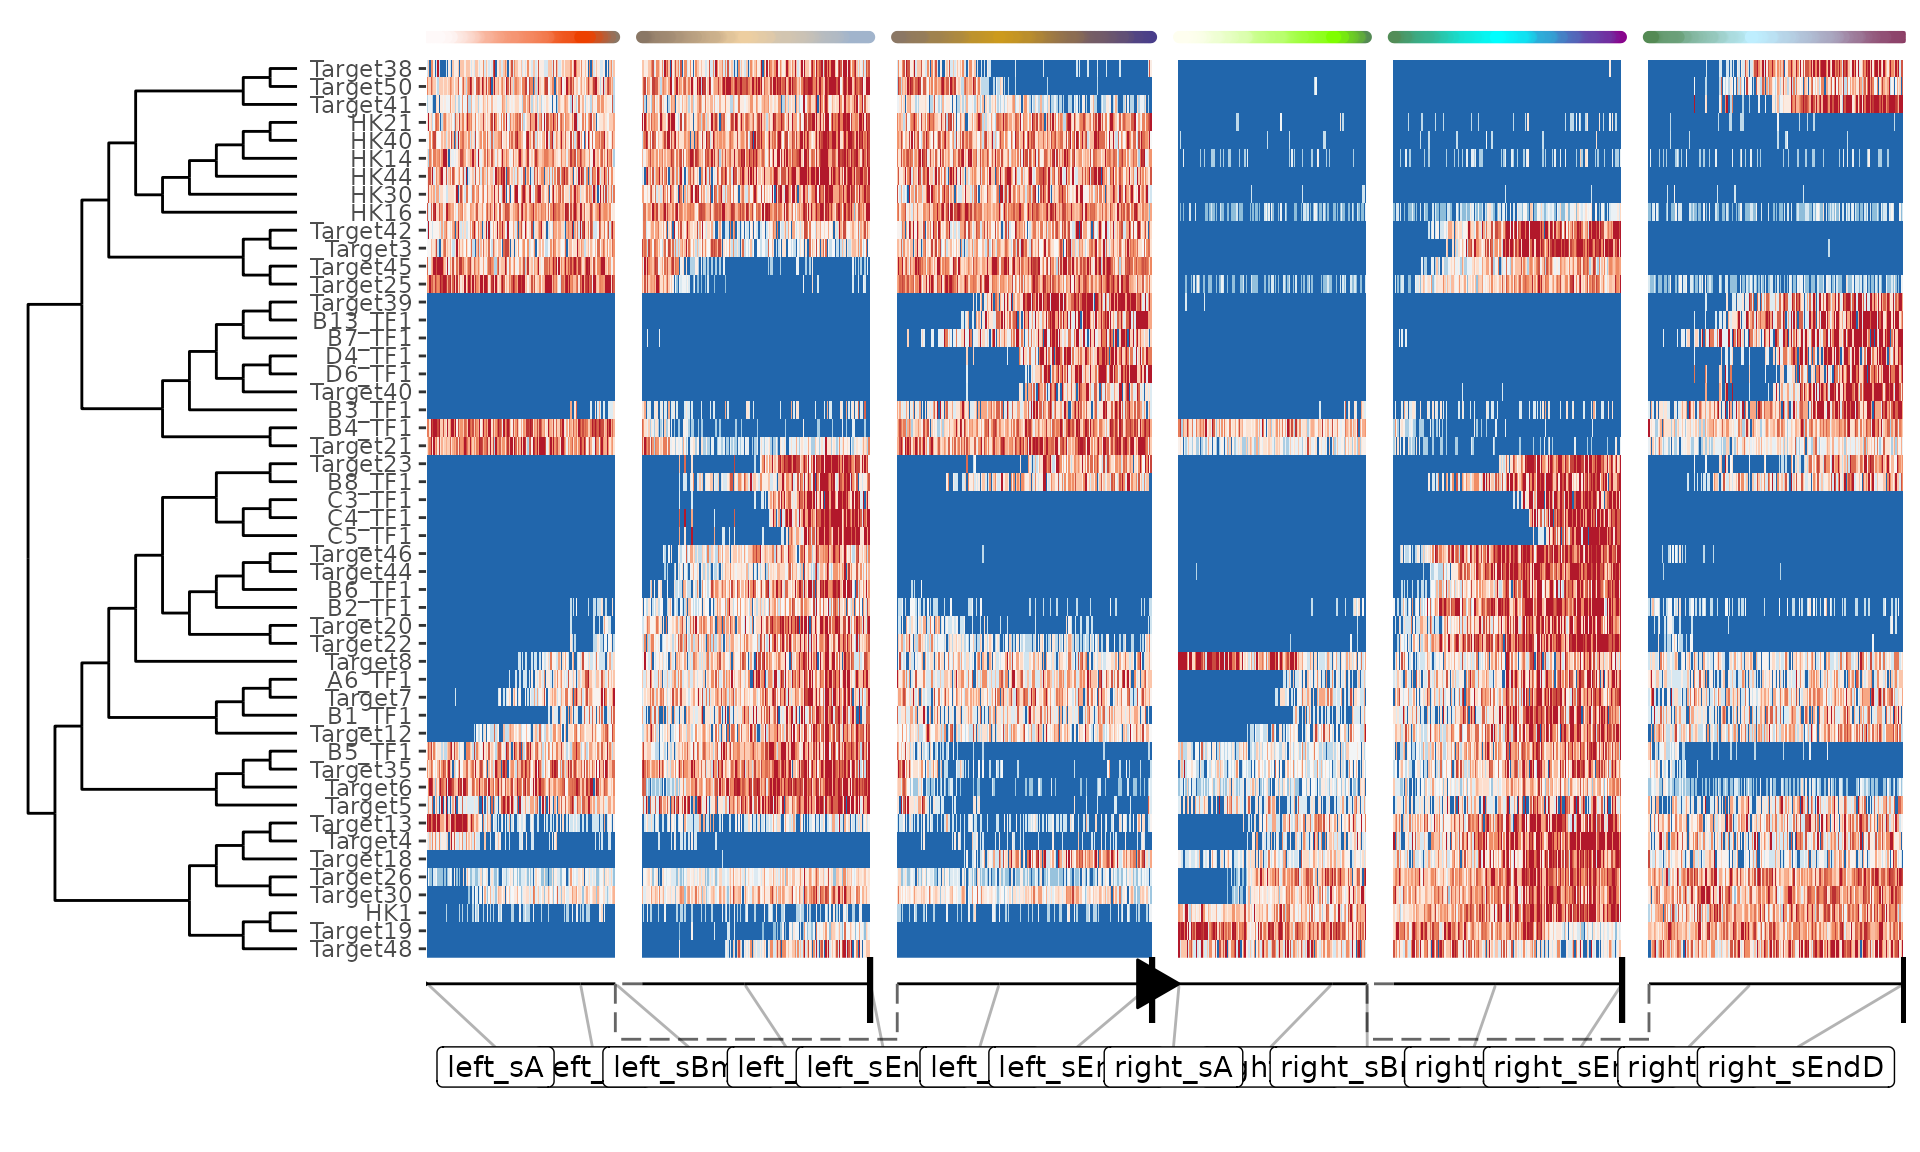
Additional thoughts
It’s definitely possible to think of different ways of simulating batch effects. For instance, you could implement a different strategy for changing the kinetics parameters between runs. You could also change the gene regulatory network itself, e.g. by changing the effect of some of the edges, or changing the targets of certain regulators.
If you come up with something, feel free to let us know on GitHub!