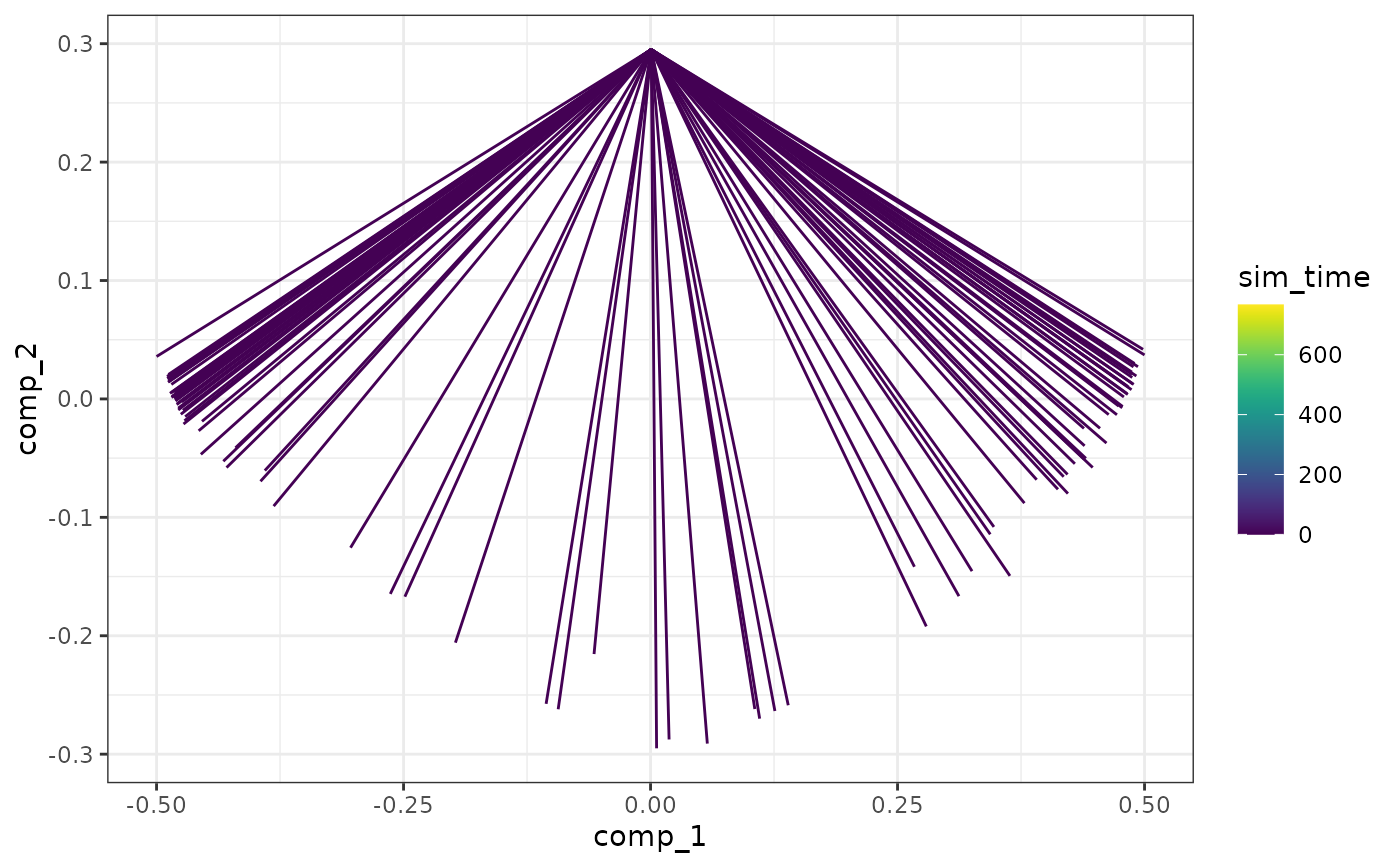
Visualise the simulations using the dimred
plot_simulations(model, mapping = aes(.data$comp_1, .data$comp_2))Arguments
- model
A dyngen intermediary model for which the simulations have been run with
generate_cells().- mapping
Which components to plot.
Value
A ggplot2 object.
Examples
# \donttest{
data("example_model")
plot_simulations(example_model)

# }
# }