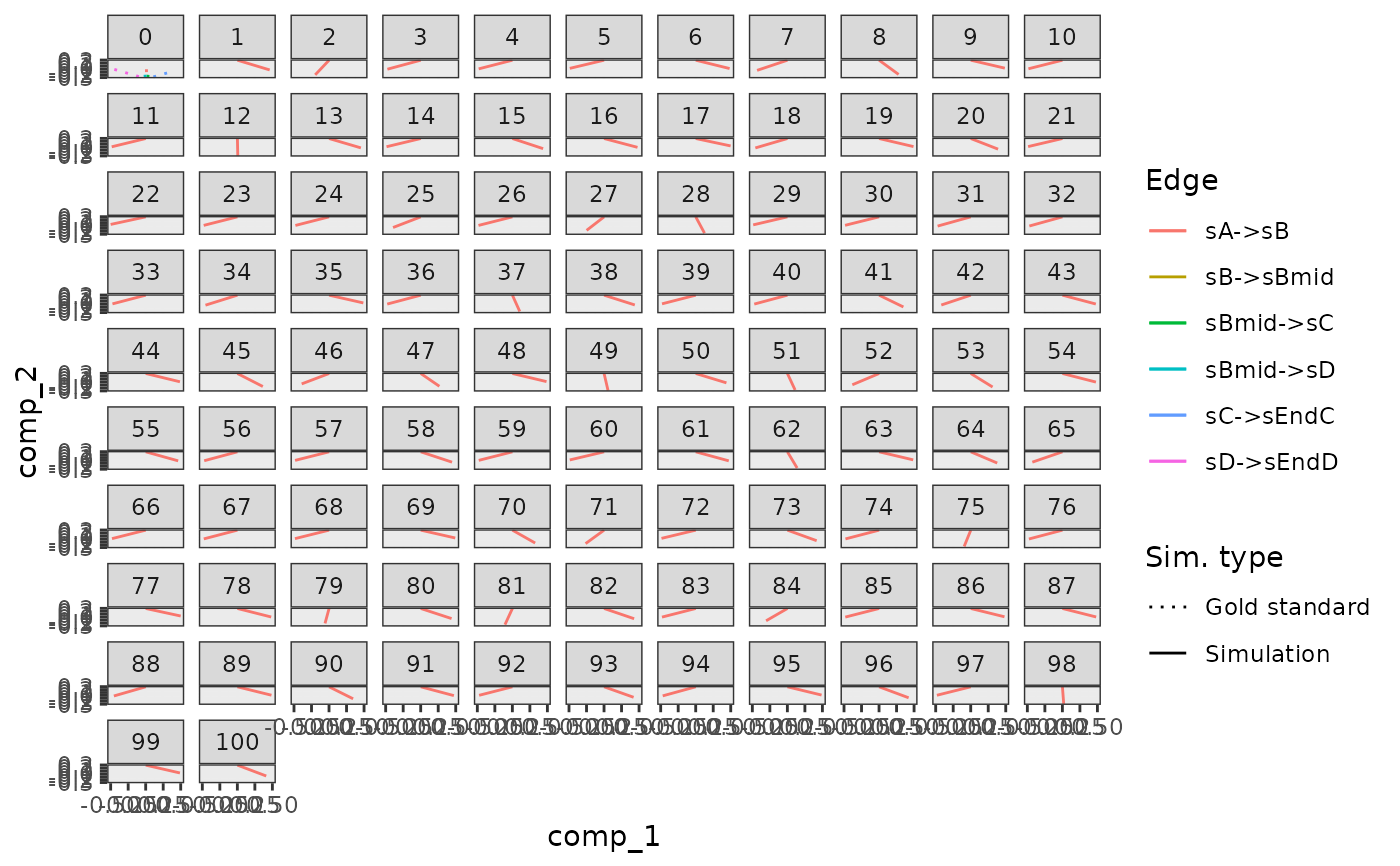
Visualise the mapping of the simulations to the gold standard
Source:R/plotting.R
plot_gold_mappings.RdVisualise the mapping of the simulations to the gold standard
plot_gold_mappings(
  model,
  selected_simulations = NULL,
  do_facet = TRUE,
  mapping = aes(.data$comp_1, .data$comp_2)
)
Arguments
- model
A dyngen intermediary model for which the simulations have been run with
generate_cells().- selected_simulations
Which simulation indices to visualise.
- do_facet
Whether or not to facet according to simulation index.
- mapping
Which components to plot.
Value
A ggplot2 object.
Examples
# \donttest{
data("example_model")
plot_gold_mappings(example_model)

# }
# }