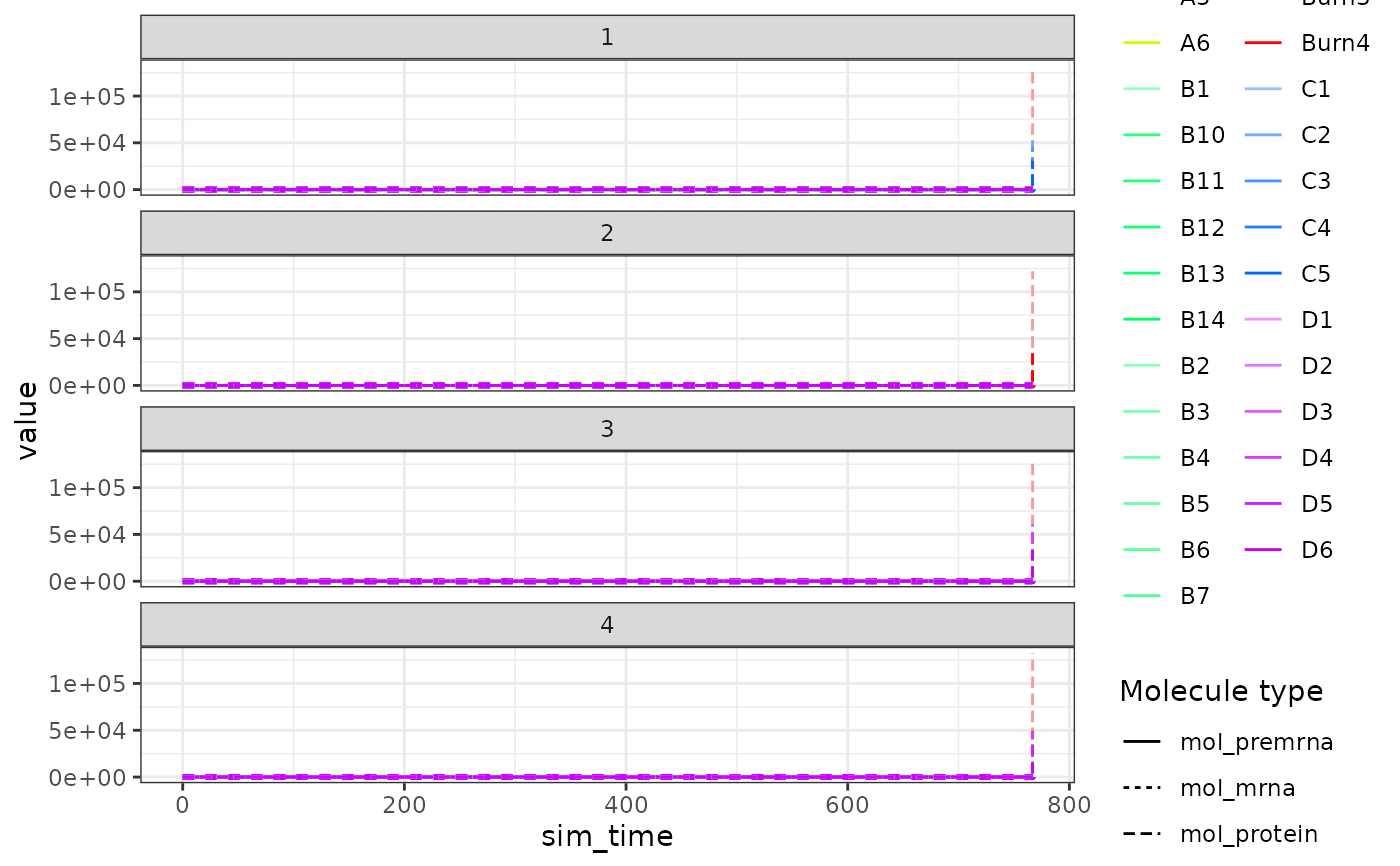
Visualise the expression of the simulations over simulation time
Source:R/plotting.R
plot_simulation_expression.RdVisualise the expression of the simulations over simulation time
Arguments
- model
A dyngen intermediary model for which the simulations have been run with
generate_cells().- simulation_i
Which simulation to visualise.
- what
Which molecule types to visualise.
- facet
What to facet on.
- label_nonzero
Plot labels for non-zero molecules.
Value
A ggplot2 object.
Examples
# \donttest{
data("example_model")
plot_simulation_expression(example_model)

# }
# }