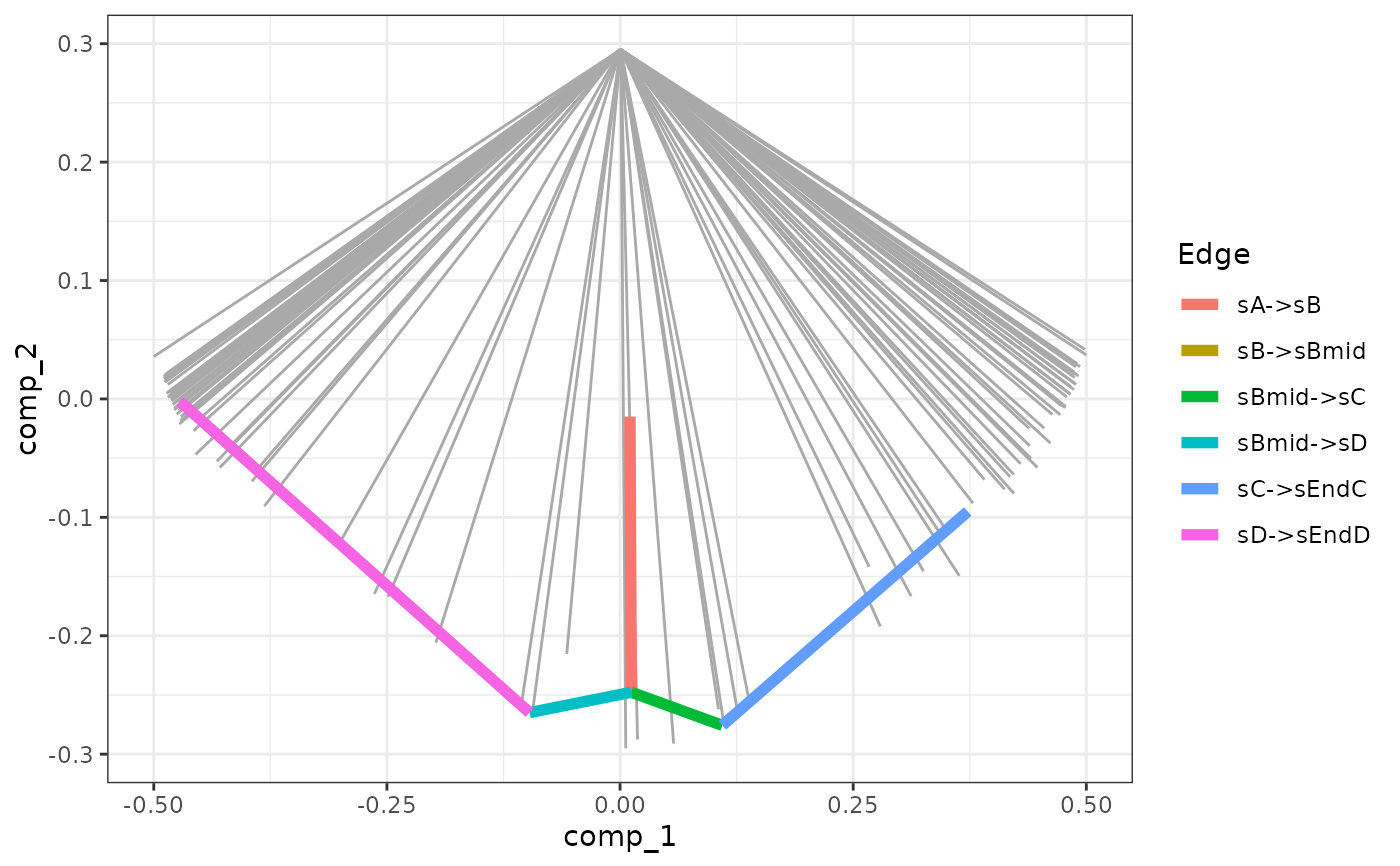
Visualise the simulations using the dimred
plot_gold_simulations(
  model,
  detailed = FALSE,
  mapping = aes(.data$comp_1, .data$comp_2),
  highlight = 0
)
Arguments
- model
A dyngen intermediary model for which the simulations have been run with
generate_cells().- detailed
Whether or not to colour according to each separate sub-edge in the gold standard.
- mapping
Which components to plot.
- highlight
Which simulation to highlight. If highlight == 0 then the gold simulation will be highlighted.
Value
A ggplot2 object.
Examples
data("example_model")
plot_gold_simulations(example_model)